
Cybenetics breaks down PSU metrics by load ranges
A single average value can be deceptive. A power supply might appear efficient or quiet on paper, but its actual performance can shift dramatically depending on the workload. To address this, Cybenetics is introducing a new way to analyze power supply units (PSUs) by breaking down their efficiency, power factor, and noise levels across specific load ranges. These new metrics are intended to provide a more granular view of how a device behaves under different conditions, from idle to full capacity.
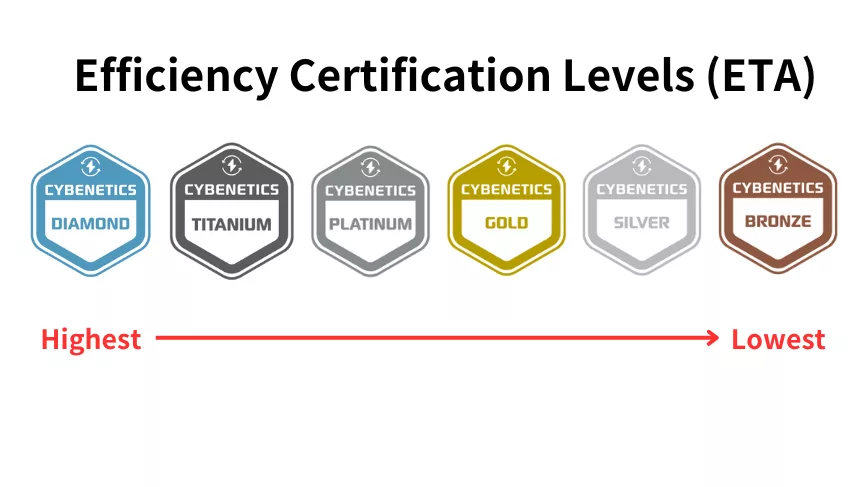
Cybenetics is supplementing its existing power supply ratings with detailed evaluations for five specific load ranges and an additional High-Load Index. These new data points cover efficiency, power factor, and noise levels across various levels of utilization. It is important to note that these metrics do not replace the current overall ratings, nor do they change the existing ETA (efficiency) or LAMBDA (noise) classifications or the overall certification. Instead, they serve as informative supplementary data to show how a device performs within its certified parameters.
Five load ranges and the High-Load Index
The new breakdown divides the rated capacity of a PSU into five segments of 20% each: 0% to under 20%, 20% to under 40%, 40% to under 60%, 60% to under 80%, and 80% to 100%. Additionally, Cybenetics has introduced a High-Load Index, which aggregates all measurement points from 70% load upwards. This index is not a separate sixth category but rather an overlap of the two highest load ranges. These percentages refer to the DC output power relative to the PSU's rated capacity. For instance, on a 1000W model, the 20% to 40% range corresponds to a system load of 200W to just under 400W.
The measurements are conducted separately for 115V and 230V. For users in the USA, the 115V values are the relevant ones. The data is based on a measured sweep of the respective PSU involving more than 1,450 load combinations. Cybenetics excludes the 0% measurement and interpolated data points. For each range, the report provides averages, the number of measurement points, the loudest single point, and the percentage of points where the fan remained stationary (fan standstill).
Why averages can be misleading: Case studies
A comparison of two power supplies demonstrates why a single average can hide significant performance differences. Consider the Cooler Master Elite Gold 650W and the Lian Li EG1000Pv2. At 230V, their average noise levels across the entire sweep are nearly identical: 22.2 dB(A) and 22.7 dB(A), respectively. However, in the High-Load Index (from 70% load up), the gap widens significantly: 22.6 dB(A) for the Cooler Master versus 27.2 dB(A) for the Lian Li. This 4.6 dB(A) difference is highly noticeable in real-world usage.
The differences are even more striking at low loads. In the 0% to under 20% range, the Cooler Master reports 21.6 dB(A), with the fan running at every measurement point. In contrast, the Lian Li reports 6.5 dB(A) in the same range, with the fan being switched off in 93% of the measurement points. It is important to note that a reported value of 5.0 dB(A) does not inherently prove a complete fan standstill, but rather a noise level near the measurement floor.
Methodology and technical details
Noise measurements are averaged on the energy scale rather than through simple arithmetic averaging of decibels, which is crucial since dB(A) is a logarithmic scale. For noise evaluation, Cybenetics holds each load point for approximately five seconds and logs the fan speed, which is then converted into a dB(A) value using a PSU-specific table. Additionally, a fixed-load table containing stabilized values at 10, 20, 50, and 100% load may be available for some models, though it is not part of every evaluation and relies on different measurements than the sweep.
For desktop PSUs, the unrounded results of the individual ranges, weighted by the number of measurement points, should mathematically lead back to the published overall values within specific tolerances: 0.1 dB(A) for noise, 0.01 percentage points for efficiency, and 0.001 for power factor. For redundant server modules, the load ranges start at 2%, which may cause slight discrepancies between the range averages and the overall mean, as the latter might include measurements below the 2% threshold.
Practical implications for consumers
This breakdown allows users to match a PSU to their specific usage profile. For systems that primarily operate at low loads, the lower ranges and the fan standstill percentage are the most relevant metrics. For high-performance workstations or gaming PCs operating near their power limits, the 80% to 100% range and the High-Load Index provide the most critical information regarding efficiency and noise.
Cybenetics is supplementing its existing power supply ratings with detailed evaluations for specific load ranges and an additional High-Load Index. These new data points cover efficiency, power factor, and noise levels across various levels of utilization. It is important to note that these metrics do not replace the current overall ratings, nor do they change the existing ETA (efficiency) or LAMBDA (noise) classifications. Instead, they serve as informative supplementary data to show how a device performs within its certified parameters.
Measurement methodology and the noise evaluation process
The noise evaluation process is distinct from a standard load sweep. During testing, a microphone measurement is not taken at every single load step. Instead, each sweep point is held for approximately five seconds while the fan speed is logged. This speed is then converted into a dB(A) value using a table specifically created for that particular PSU in a semi-anechoic chamber. Because these measurement points are brief, a fan might experience a delayed reaction to rapid load changes; therefore, the reported values must be understood in the context of this measurement method.
A critical metric in these reports is the fan standstill percentage. For example, during a 230V sweep, the Cooler Master Elite Gold 650W showed a 0% fan standstill rate, whereas the Lian Li EG1000Pv2 showed 17%. It is important to note that a recorded value of 5.0 dB(A)—the lowest possible value in the tables—does not inherently prove the fan has stopped. The protocol uses this value when the noise level falls below the ambient noise floor of the testing chamber, but some devices can reach this value even while the fan is spinning. A meaningful assessment requires looking at the noise level in conjunction with the reported fan standstill percentage.
Load ranges and the High-Load Index
The new breakdown provides a more nuanced description of PSU behavior by moving away from a single condensed average. The data is divided into specific segments: the lowest load ranges are particularly useful for identifying efficiency and power factor drops, while the 40% to 60% and 60% to 80% ranges reveal whether the fan curve remains flat or rises with increasing load. The 80% to 100% range and the High-Load Index provide insights into operation at the upper end of the capacity. Additionally, the single loudest measurement point is included to complement the average by showing the worst-case scenario encountered.
Beyond the sweep results, Cybenetics may also provide a separate table of stabilized measurements at fixed loads of 10, 20, 50, and 100%. This table compares fan speed, noise, and intake temperature under both normal (approx. 30–32 °C) and high (approx. 40–47 °C) ambient temperatures. This data is intended as supplementary guidance and is not available for every PSU evaluation. It is important to note that these are separate measurements from the sweep and are not a replacement for the load range evaluation.
Practical application for consumers and server operators
For consumers, the most important factor is which load range their specific system typically operates in. A PC that mostly runs well below 40% of the PSU's rated capacity will benefit most from examining the lower load ranges and the fan standstill percentage. Conversely, users who frequently run high computational loads or operate near the PSU's rated capacity should place more weight on the 80% to 100% range and the High-Load Index. This allows for a more tailored reading of the data based on individual usage profiles.
For server environments, this breakdown is equally valuable. Efficiency and power factor can vary significantly depending on the load. For instance, a server PSU might show a load range value of 95.27% while its sweep average is 93.3%. Such detailed information is crucial for precise power planning in data centers where efficiency fluctuations at specific loads can impact long-term operational costs.
Conclusion: Context over new ratings
Ultimately, these load range values do not change the existing ETA or LAMBDA ratings. Instead, they provide the necessary context to interpret them more accurately. By looking at the combination of average values, individual peaks, and fan standstill data, users can obtain a much clearer picture of how a power supply is likely to behave in real-world daily operation.
A single average value can be deceptive. A power supply might appear efficient or quiet on paper, but its actual performance can shift dramatically depending on the workload. To address this, Cybenetics is introducing a new way to analyze power supply units (PSUs) by breaking down their efficiency, power factor, and noise levels across specific load ranges. These new metrics are intended to provide a more granular view of how a device behaves under different conditions, from idle to full capacity.
Cybenetics is supplementing its existing power supply ratings with detailed evaluations for five specific load ranges and an additional High-Load Index. These new data points cover efficiency, power factor, and noise levels across various levels of utilization. It is important to note that these metrics do not replace the current overall ratings, nor do they change the existing ETA (efficiency) or LAMBDA (noise) classifications or the overall certification. Instead, they serve as informative supplementary data to show how a device performs within its certified parameters.
Five load ranges and the High-Load Index
The new breakdown divides the rated capacity of a PSU into five segments of 20% each: 0% to under 20%, 20% to under 40%, 40% to under 60%, 60% to under 80%, and 80% to 100%. Additionally, Cybenetics has introduced a High-Load Index, which aggregates all measurement points from 70% load upwards. This index is not a separate sixth category but rather an overlap of the two highest load ranges. These percentages refer to the DC output power relative to the PSU's rated capacity. For instance, on a 1000W model, the 20% to 40% range corresponds to a system load of 200W to just under 400W.
The measurements are conducted separately for 115V and 230V inputs. For users in the US, the 115V data is the most relevant. Cybenetics utilizes results from a large-scale sweep test, which includes over 1,450 load combinations, excluding the zero point and interpolated data. For each range, the report will specify average values, the number of measurement points, the highest recorded noise level (peak noise), and the percentage of time the fan operated in 'fan stop' mode.
Why average values are insufficient: real-world examples
Comparing two different models clearly demonstrates how aggregate figures can hide significant behavioral differences. Take the Cooler Master Elite Gold 650W and the Lian Li EG1000Pv2. When tested at 230V, their average noise levels across the entire load cycle are nearly identical: 22.2 dB(A) and 22.7 dB(A), respectively. However, when looking at the High-Load Index (70% load and above), the gap becomes obvious: 22.6 dB(A) for the Cooler Master versus 27.2 dB(A) for the Lian Li. A difference of 4.6 dB(A) is a substantial shift in perceived noise.
The situation at low loads is even more telling. In the 0% to 20% range, the Cooler Master outputs 21.6 dB(A) with the fan running constantly. In the same range, the Lian Li shows only 6.5 dB(A), with the fan remaining stationary in 93% of cases. It is important to note that a value like 5.0 dB(A) does not guarantee a complete fan stop; it is a statistical indicator of noise levels, as the threshold might be triggered when the noise falls below the ambient noise of the testing chamber.
Measurement methodology and the 'Fan Stop' nuance
The noise measurement process differs from a standard load sweep. During testing, the microphone does not take an instantaneous reading at every step. Instead, the load point is held for approximately five seconds while the fan speed is recorded. This speed is then converted into a dB(A) value using a custom-built table for that specific PSU, measured in an anechoic semi-spherical chamber. Because these measurements are brief, the fan might not react to sudden load changes, meaning the figures should be viewed within the context of this specific methodology.
Special attention is paid to the 'fan standstill' metric. For example, during 230V testing, the Cooler Master showed a 0% standstill rate, while the Lian Li showed 17%. Users should not confuse the minimum noise level (e.g., 5.0 dB(A)) with a total fan stop; this threshold is used when noise levels are below the chamber's background noise, and it can appear even if the fan is spinning slowly.
How to use this data for your build
This detailed breakdown allows for more precise selection based on your specific PC usage profile. If your system spends most of its time under 40% load, the lower ranges and fan standstill percentages are critical. For high-performance workstations or gaming rigs operating near capacity, the 80–100% range and the High-Load Index are the most decisive factors.
- The 40–60% and 60–80% ranges show whether the noise curve remains flat or begins to rise.
- The 80–100% range and High-Load Index provide insight into performance under peak loads.
- The 'peak noise' metric reveals the worst-case scenario, complementing the average values.
- Stable measurements at fixed loads (10, 20, 50, and 100%) show the difference in noise and temperature at both ambient (30–32 °C) and high (40–47 °C) temperatures.
For server-grade solutions, this granularity is equally vital. Efficiency and Power Factor can vary significantly depending on the load. In data centers, where power planning is precise, the difference between a sweep average and a specific range value—even if it is only a fraction of a percent—can be significant for long-term energy management.
Гика
